Don't blindly trust your summary statistics.
Summary statistics are a common way to evaluate and compare performance data. They are simple, easy to compute and most people have an intuitive understanding of them, therefore mean, median, standard deviation and percentiles tend to be the default metrics used to report, monitor and compare performance.
Many of the common Load and Performance testing tools (ApacheBench, Httperf and Locust.IO) produce reports using these metrics to summarize their results. While easy to understand, they rely on the assumption that what you are measuring stays constant during your test and even more importantly that the set of samples follow a normal distribution, often this is not the case.
In this post we will evaluate two tricky scenarios which I have seen come up in real world testing. First a simple example to show how two very different distributions can have the same summary statistics and second an example of how summary statistics and distributions can conceal underlying problems.
First, let's start with a simple set of performance test results, featuring 1000 samples of a web service endpoint.
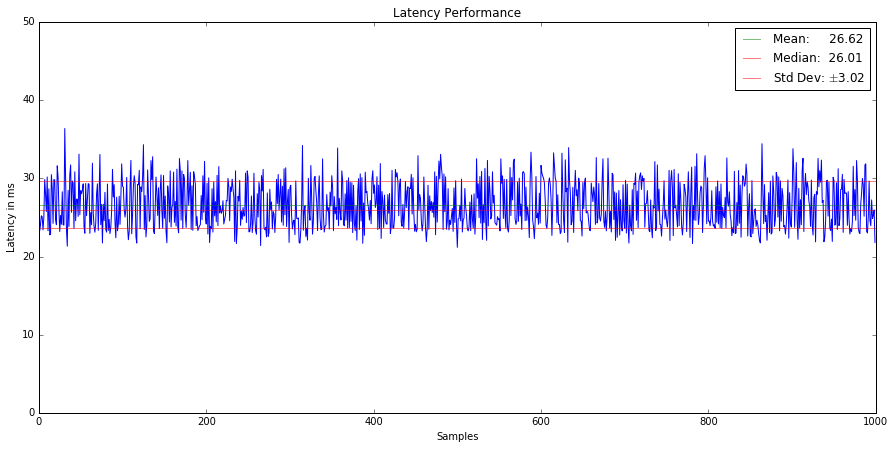
Our favorite summary statistics have been overlaid, showing us the mean, median and +/- standard deviation. At first glance there is nothing interesting about these results. We see some variability, perhaps due to network jitter or load on the system, but otherwise a pretty consistent result. Can you identify any interesting features? Given these summary statistics, could you determine a change in behaviour?
In the above example, the mean sits at 26.6, the median at 26.01 and we have a standard deviation of around 3. Given that the median is slightly lower than the mean suggests we may have a positively skewed distribution. Which is a common feature of latency distributions, since there are at least a few packets that always hit snags such as errors or taking the scenic network path.
If we just look at the summary statistics, we do not get the full picture. Figure 2 shows two distributions with an identical mean, median and standard deviation, but as you can see these are very different in shape.
Could you identify which distribution corresponds to the samples from figure 1?
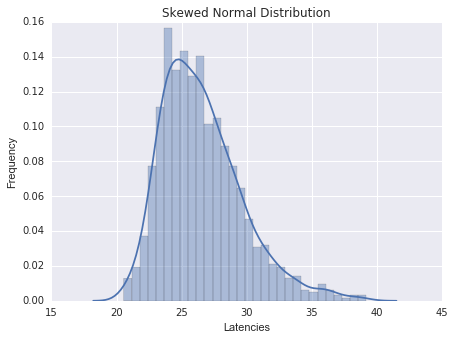
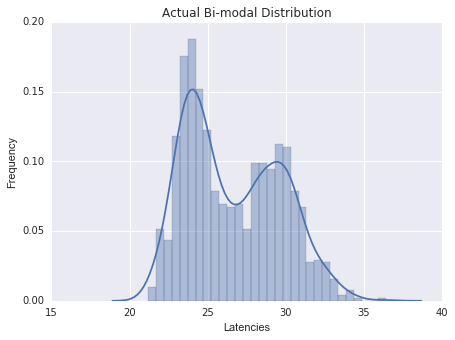
Intuitively and most commonly with latencies, the distribution tends to look more like figure 2(a), but in our case the actual distribution is as in figure 2(b). Multi-modal distributions often indicate some sort of caching at work, the lower mode representing a cache hit and the higher mode a cache miss. Understanding changes in the relationship between cache hits and misses is very important, as a rise in cache misses could indicate a serious problem.
Given only the medians, means and standard deviations, it would be impossible to determine any difference, therefore performance changes such as these would never surface. There is no easy solution here besides adding more advanced metrics. One such metric to consider is the Kolmogorov–Smirnov test, which computes the difference between two Cumulative Density Functions.
Another gotcha are results, which when evaluated based on their summary statistics and their distribution (see figure 3), look to be completely normal, no bimodal tendencies, a slight right skew, but nothing that stands out.
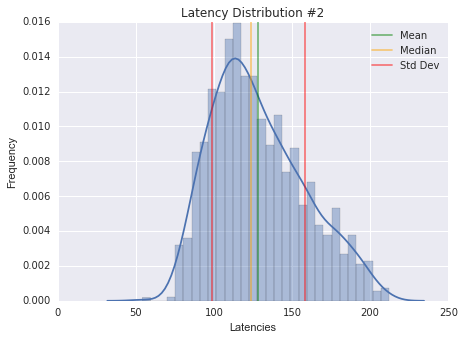
These are the trickiest, the ones that don't ring any alarm bells, are the ones that will bite you once you go into production. The critical missing piece is the time-domain information of the original results, which by definition cannot be captured by summary statistics or distributions.
Collecting time-domain information usually is not a problem, but on high throughput tests, it may become prohibitively expensive, both memory- and storage-wise. Instead you may be tempted to purely rely on streaming statistics, perhaps using a snazzy sliding-window histogram to do reservoir sampling or something like the t-digest. These are fantastic approaches and I am absolutely in favor of using these, but if you do not keep at least some interval-based snapshots of the streaming statistics, you may end up discarding valuable information.
Let's return to our example from figure 3, when viewed as a time-series, see figure 4, it is clear that we have significant trend!
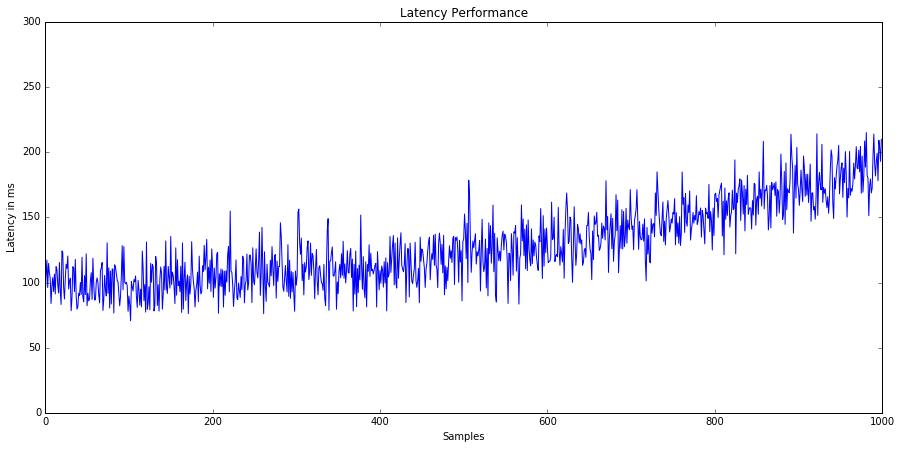
Trends cannot be characterized using summary statistics and add extra complexity to performance comparisons, therefore should be avoided whenever possible.
To ensure that that you trends do not secretly distort your statistics, compute a robust linear regression metric (I've had good luck with the RANSAC algorithm) to quantify the trend in terms of slope and y-intercept. Given these metrics it becomes easy to develop a sanity check to determine whether any drastic trend changes have occurred.
Summary statistics can be valuable first indicators about performance, but can easily lead to false conclusions if not combined with other metrics. It is especially important to retain time-domain information to be able to detect trends which might otherwise be hidden. Stay tuned for future posts which will deep dive on how to accurately detect the slightest performance changes.